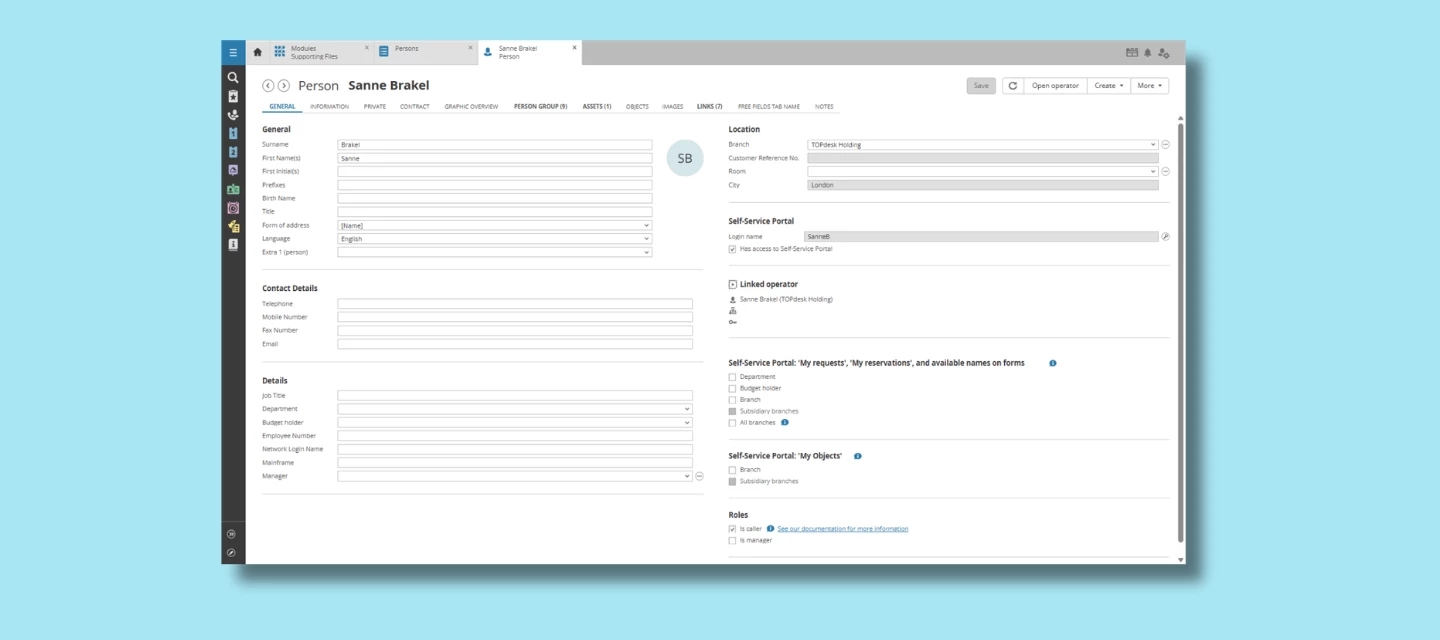

Easier management of linked operators and person cards
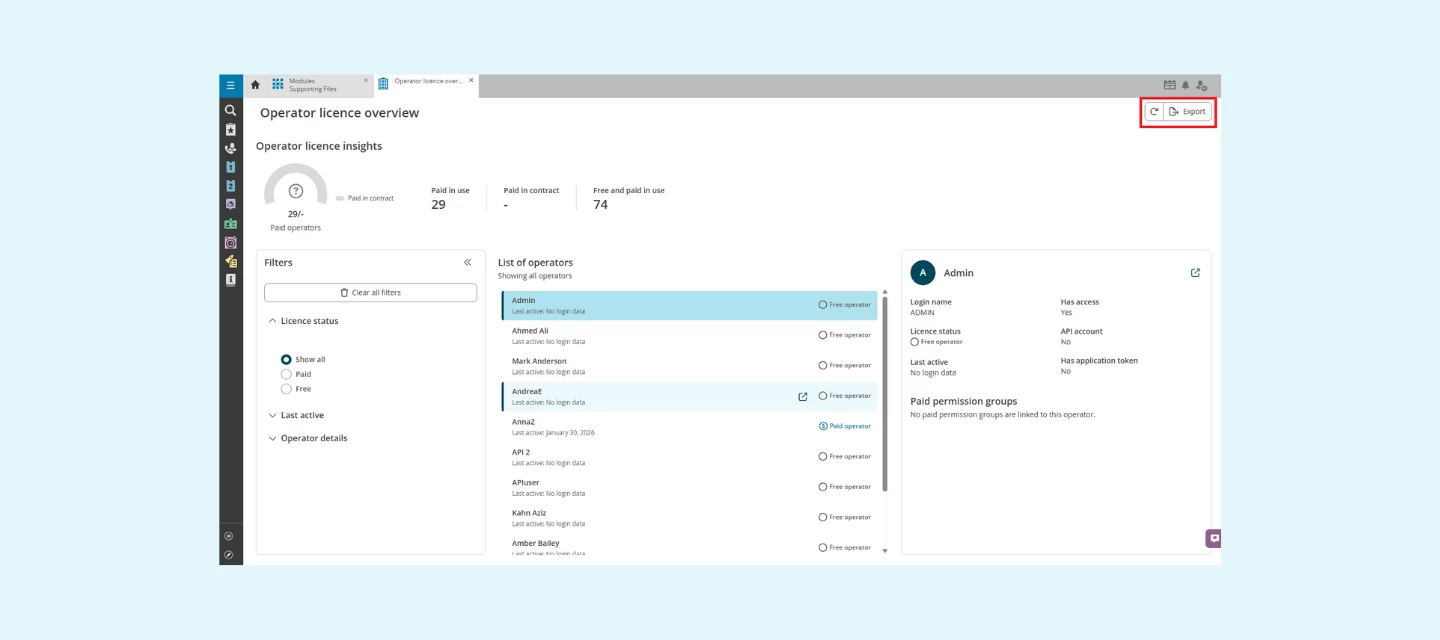
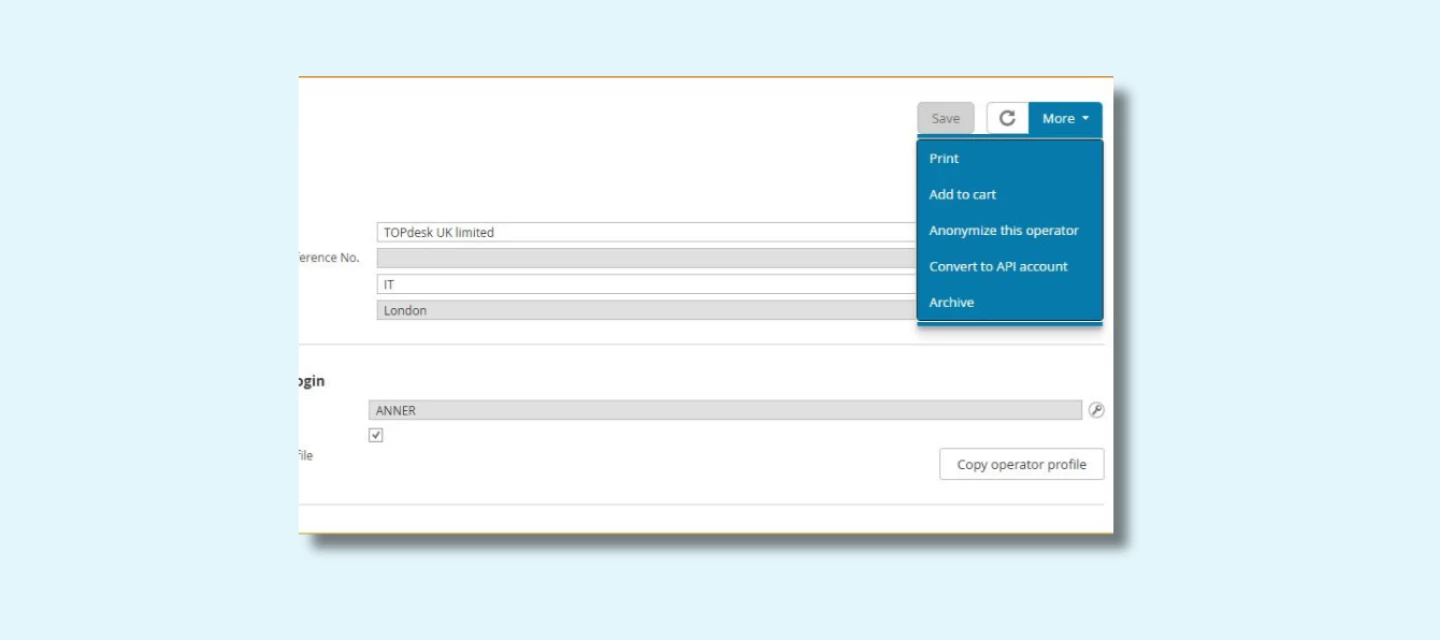
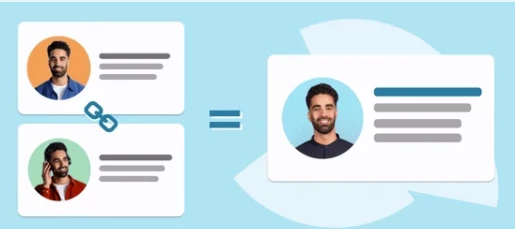
Earlier, we announced some upcoming changes as part of the One TOPdesk User project. Now, the first improvements are going live, making it easier to manage users consistently from the person card.As the person card becomes the leading entity in TOPdesk, we’re aligning several actions between person and operator cards. Here’s what’s new.Archiving and de-archiving — coming in JuneFrom version 16.06.007 onwards, archiving and de-archiving will follow the person card.This means that when you archive a person card, the linked operator card will automatically be archived as well. The same applies when de-archiving — everything stays in sync. This also applies to updates made through integrations. What does this mean for you?If you’re using integrations to manage users, this is a good moment to review how users are identified. Especially if you rely on a name or email address as a unique identifier, you might want to switch to a more stable value, such as an employee number. This helps prevent users from being archived unintentionally. Deleting — already availableDeleting is also aligned with the link between person and operator cards. This was released in version 16.03.019.When you delete a person card without calls, the linked operator card will also be deleted automatically. This keeps your user administration clean and consistent, without extra steps. Anonymization — expected early JulyWe’re also simplifying how anonymization works by bringing operator and person anonymization together into one approach.This leads to two important changes:Separate anonymization settings for operators will be removed. Operator anonymization will follow the same process and rules as person anonymization. When anonymizing a person card via the interface, the linked operator card will also be anonymized.Instead of managing this in different places, everything will be handled through the person card. What does this mean for you?If you currently anonymize operators (for example, in the context of GDPR), the location and setup will change. We expect this update in early July, giving you time to review your current setup and align internally with your functional administrator or privacy officer. Bringing it all togetherThese changes are part of a bigger step towards one consistent way of managing users in TOPdesk. By aligning operator and person cards, daily management becomes simpler, clearer, and less error-prone.As always, feel free to share your questions or experiences in the comments, we’d love to hear how this works in your environment.