

The Incident Management Dashboard is the first full best‑practice dashboard available in the TOPdesk Reporting Hub — and it’s designed to give you instant, meaningful insight into every part of your incident process. Whether you're monitoring trends, identifying bottlenecks, or fine‑tuning service performance, this dashboard brings all the essentials together in one clear, intuitive view.
Like all dashboards in the Reporting Hub, it is built on TOPdesk best practices: reports that provide immediate value right out of the box, while still offering full flexibility through interactive drill‑downs and powerful filters.
Below, we’ll walk you through each tab of the Incident Dashboard and show how it helps you make informed, data‑driven decisions.
What You’ll Find in the Incident Management Dashboard
The dashboard currently consists of three dedicated tabs, each focusing on a key area of Incident Management:
- Incident Composition
- Workload
- Compliance
Each tab includes its own filter panel so you can instantly tailor insights to specific time periods, teams, categories, or services.
Incident Composition
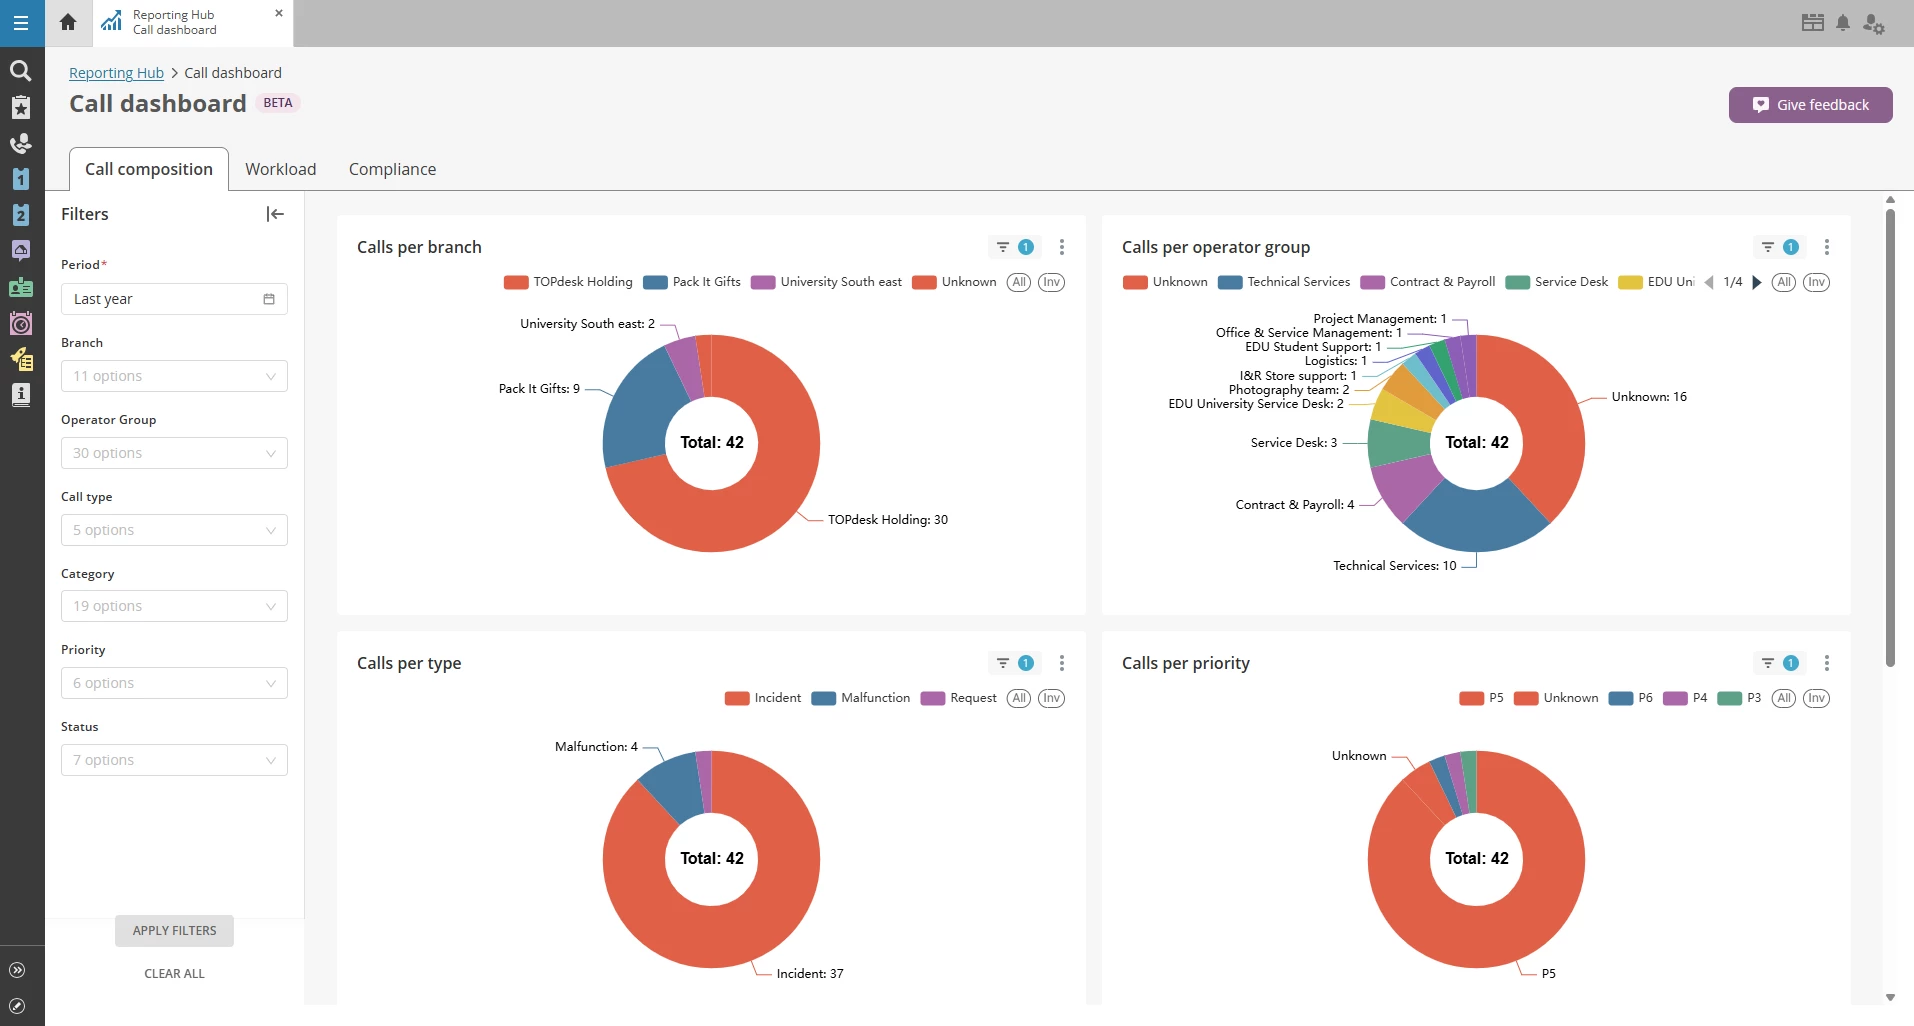
This tab gives you a clear overview of how incidents flow into your service organization, broken down into meaningful groupings such as category, operator group, priority, or any other relevant attribute.
What you can do here:
- See incident distribution at a glance through intuitive pie charts.
- Drill down for details by right‑clicking on any segment and selecting Drill to detail by to open a full list of incidents within that group.
- Apply cross‑filters simply by clicking on a chart segment — instantly updating all other visuals on the page.
This makes it incredibly easy to spot patterns, outliers, or unexpected spikes in specific categories.
Workload
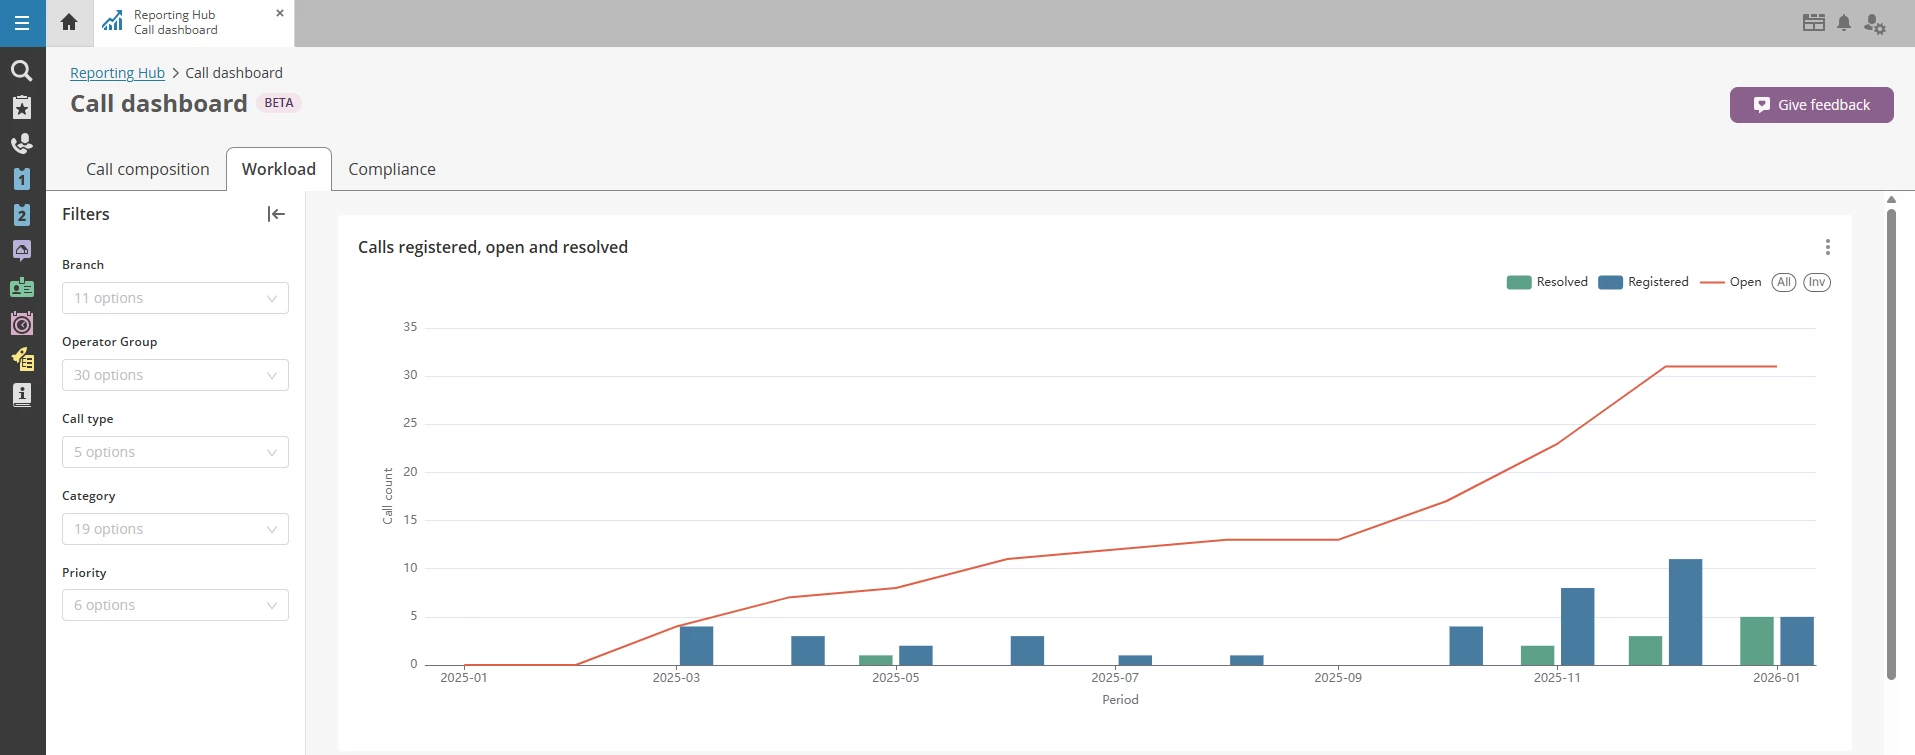
The Workload tab focuses on the operational heartbeat of your team — showing the volume of open, registered, and resolved incidents over time.
What you’ll see:
- A combined bar/line chart per month that visualizes how incident load develops.
- A table view with the same data for those who prefer a more detailed or export‑friendly format.
This tab is ideal for:
- Tracking seasonality or structural workload changes
- Understanding how well your team is keeping up with incoming incidents
- Supporting staffing or resourcing decisions with concrete figures
Compliance
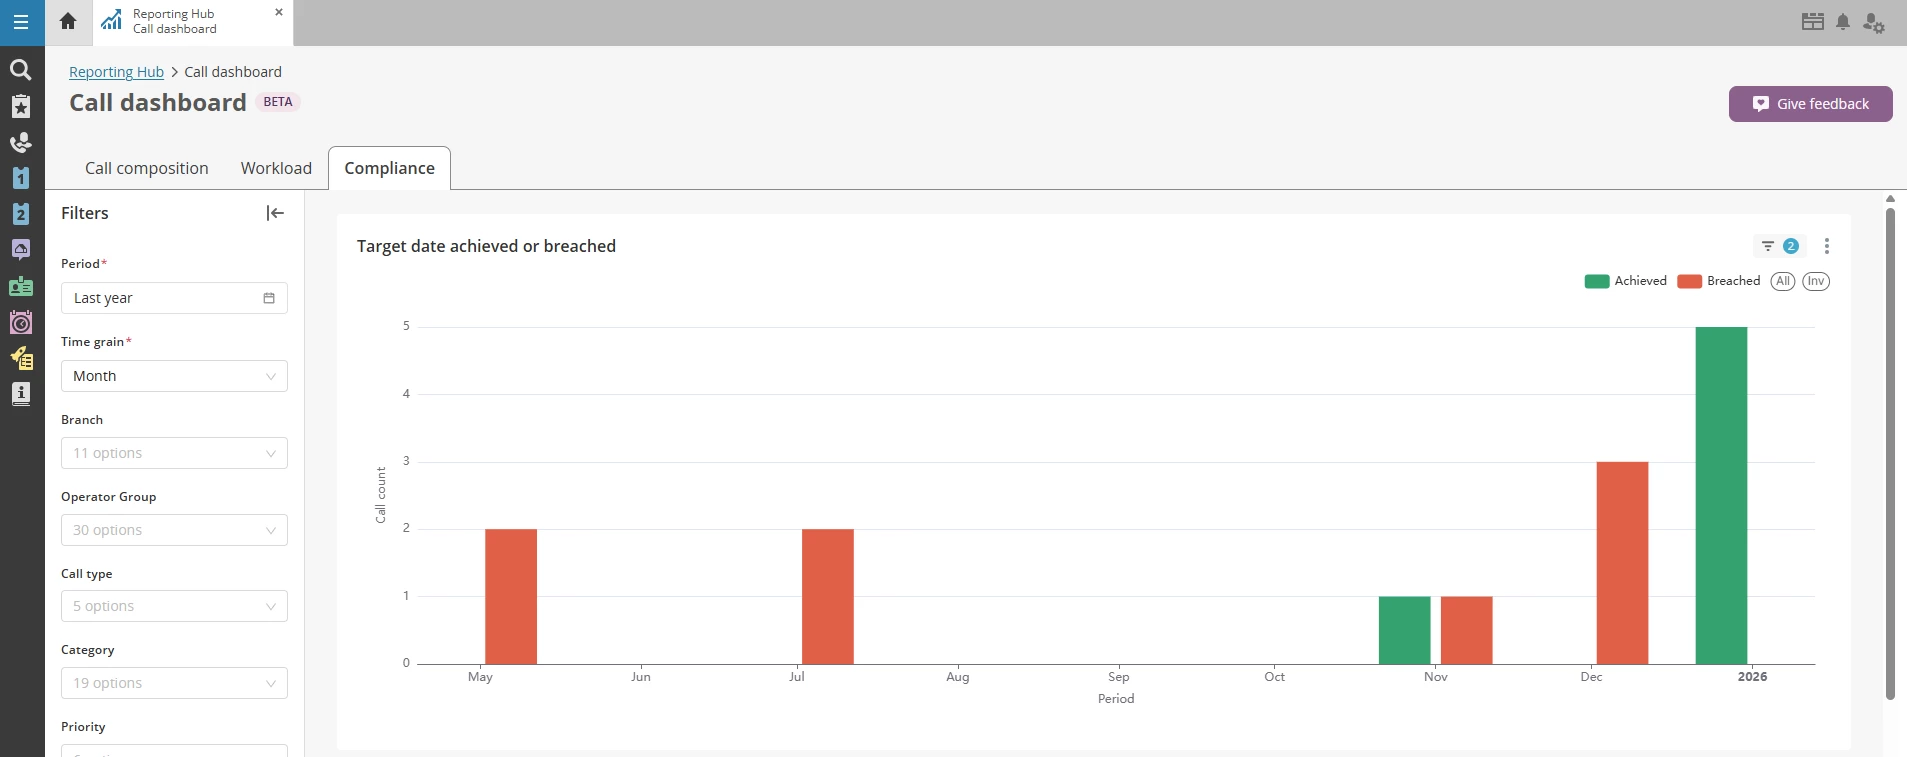
The Compliance tab gives a clear picture of how your team is performing against SLAs or target dates.
Insights provided:
- Per month:
- ✔️ How many incidents met their target date
- ❌ How many incidents breached their target date
- A matching table view for reviewing details or exporting the data
This helps you quickly identify:
- Where performance is improving
- Where processes may need adjustment
- Whether certain teams or categories consistently struggle with SLA adherence
Flexible Filters on Every Tab
Every tab in the Incident Dashboard includes its own filters panel. This means you can tailor your insights to specific operator groups, categories or subcategories, priority levels, time ranges and more
This flexibility lets you zoom in on exactly what matters to your team, without needing to adjust the entire dashboard.
How the Incident Dashboard Fits into the Bigger Picture
The Incident Dashboard is one of the first best‑practice dashboards available in the TOPdesk Reporting Hub, alongside, for instance, the Knowledge Management Dashboard (explained in a separate deep‑dive post).
These dashboards are designed to gradually replace the old report wizard with modern, intuitive, out‑of‑the‑box reporting tailored to real‑life service scenarios.
More dashboards are currently in development, and customer feedback is actively shaping future iterations.
We’d Love Your Feedback
The Reporting Hub is continually improving. Have ideas for new reports or filters? Let us know through the feedback button inside the Reporting Hub — or submit your ideas directly via TIP. You can also browse and vote on existing ideas there. Your input directly shapes what we build next.