


Customer Satisfaction Dashboard Now Available in the TOPdesk Reporting Hub
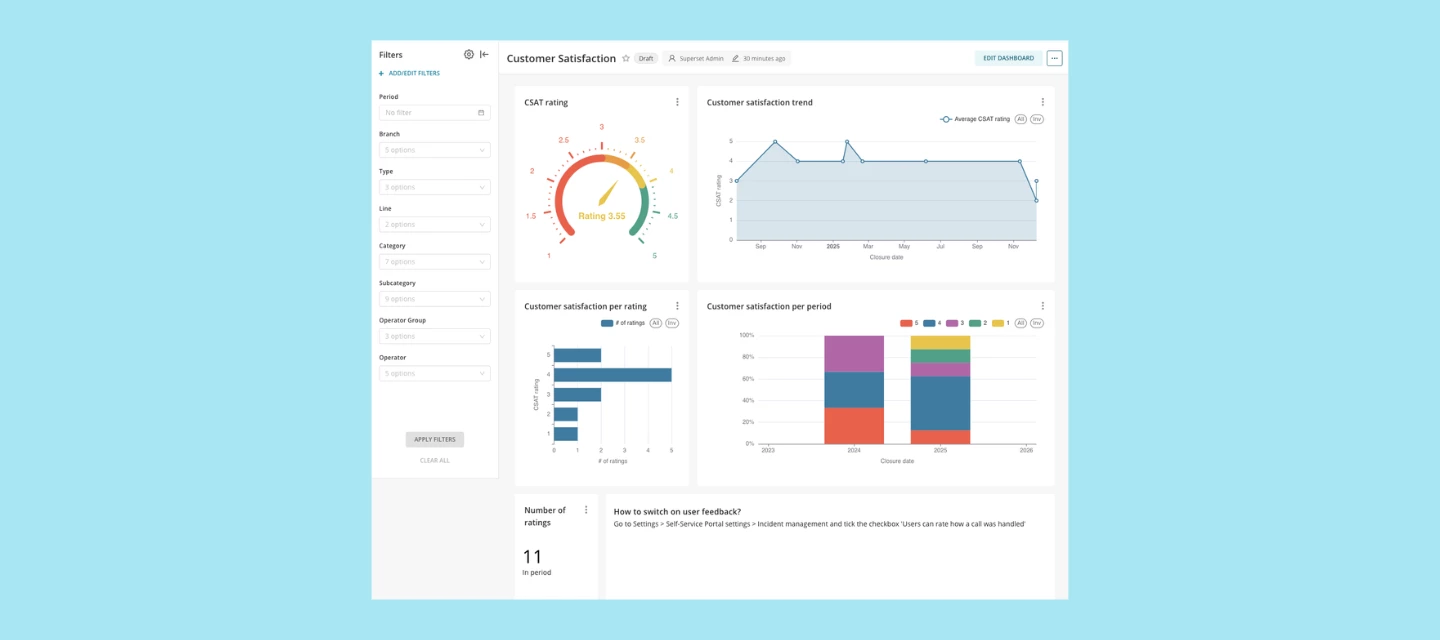
Customer satisfaction is one of the most important indicators of success in IT Service Management. With that in mind, we’re excited to introduce a new addition to the TOPdesk Reporting Hub: the Customer Satisfaction (CSAT) Dashboard.
This dashboard brings your existing star‑rating data to life. It gives you a clear overview of how end users experience your services, helping you understand what’s going well and where improvements will have the most impact.
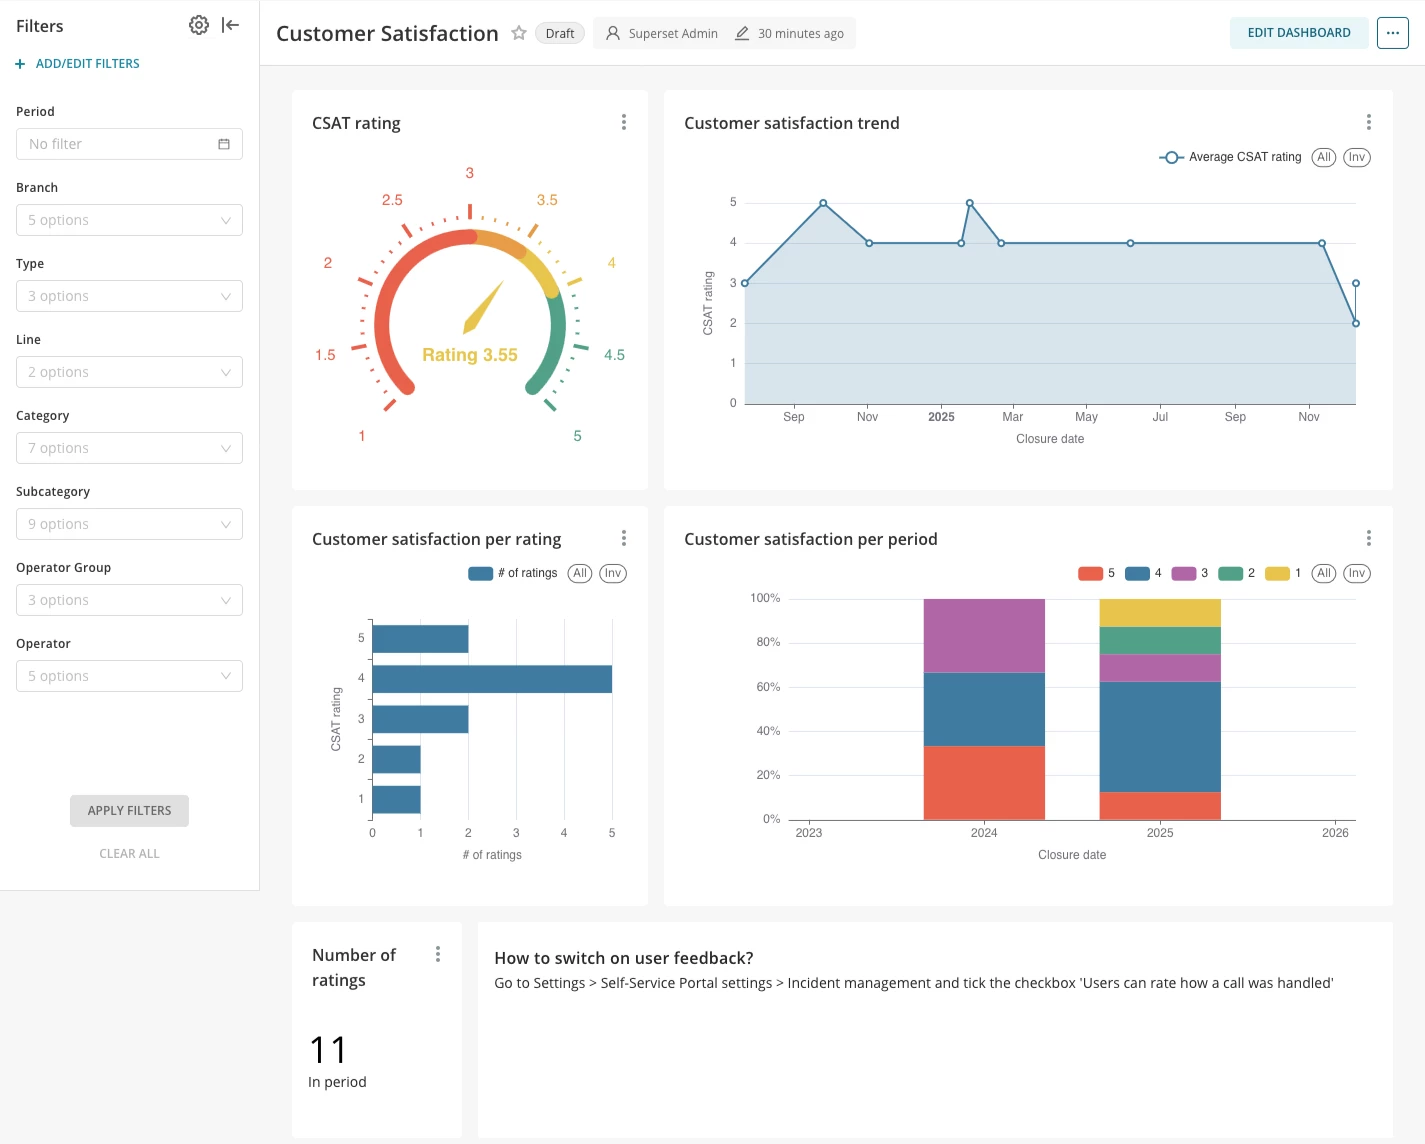
What you’ll find in the CSAT Dashboard
The CSAT Dashboard is designed to give you meaningful insights right away. Once opened, you’ll see:
- Overall satisfaction score
A straightforward view of your average star rating for the period you select. It helps you quickly determine whether your service is meeting expectations.
- Rating distribution
A breakdown of how many 1‑ to 5‑star ratings you’ve received. This makes it easy to understand whether feedback skews mostly positive, or if there are specific points that need attention.
- Satisfaction trends over time
Charts that show how customer sentiment develops across weeks or months. This is ideal for evaluating the effect of process changes, staffing shifts, or seasonal peaks.
- Insights per team, category or service area
Use filters to zoom in on the parts of your service delivery that matter most to your organization. Whether you want to focus on one team or a specific ticket type, the dashboard helps you get to the details.
Ready to use from the moment you open it
Just like the other dashboards in the Reporting Hub, the CSAT Dashboard works out of the box. Once star ratings are enabled in your environment, the dashboard automatically starts presenting your data in a clear, visual way. And with filtering options, you can adapt the view to your needs without any complex setup.
Why it helps
The CSAT Dashboard supports your continuous improvement efforts by showing:
- Whether your services are meeting customer expectations
- The value your teams deliver across the organization
It gives you the insights you need to make confident, data‑driven decisions.
Start exploring today
The CSAT Dashboard is now available in the TOPdesk Reporting Hub.
If you’re already collecting star ratings, your insights are ready for you to explore.
If not:
Tip:
You can turn on star ratings in your settings. It only takes a moment and gives your end users a simple way to share feedback. Once enabled, the CSAT Dashboard will automatically visualize their responses and help you start collecting valuable insights right away.
If you have feedback or suggestions for the CSAT Dashboard, you can share them directly with us through TIP.