

Reliable services start with predictable change processes. To help you understand and improve how changes flow through your organization, we've added a new Change Management dashboard to the TOPdesk Reporting Hub (Beta).
This first release brings two views, both designed to match the existing Reporting Hub dashboards so they feel familiar from day one:
- Change composition: how your changes are distributed
- Change compliance: how well changes meet their targets
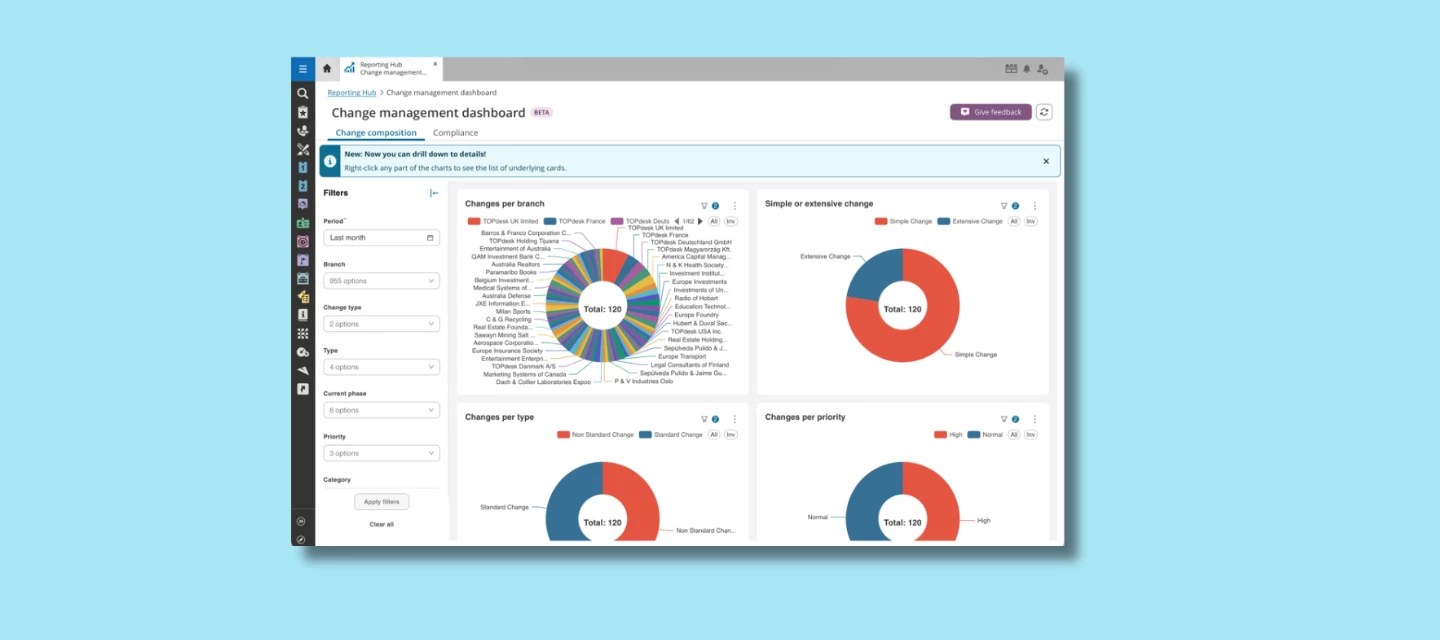
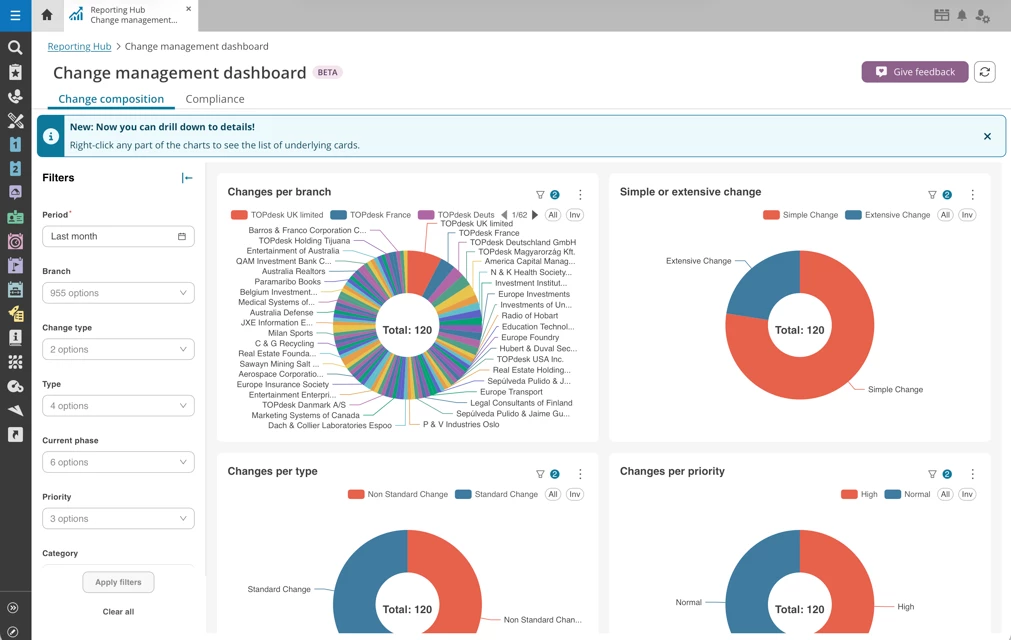
Change composition
See at a glance how changes break down across your organization, grouped by:
- branch
- category
- operator group
- change type (e.g. simple or extensive)
- priority and current phase
Spot patterns instantly, where most changes originate, which types dominate, and where work piles up.
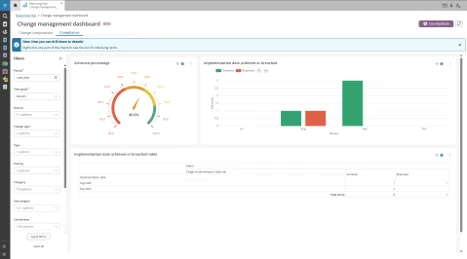
Change compliance
Track performance over time with a clear view of:
- changes that met their target
- changes that breached their target
- month-by-month trends
This helps you see whether your process is improving and where to focus next.
Drill down to the details
Like every Reporting Hub dashboard, you can click into any chart to reveal the change cards behind the numbers. From insight to action in one click.
Ready to use
The dashboard is live now in the Reporting Hub (Beta). Once your Change Management data is in TOPdesk, it visualizes automatically. Use filters to zoom in on what matters most to your organization.
What's next?
This is just the first step. Upcoming updates include:
- expanded compliance insights
- workload dashboards for Change Management and incidentmanagement together
- additional drill-down capabilities
We'd love to hear what you think your feedback shapes what comes next.